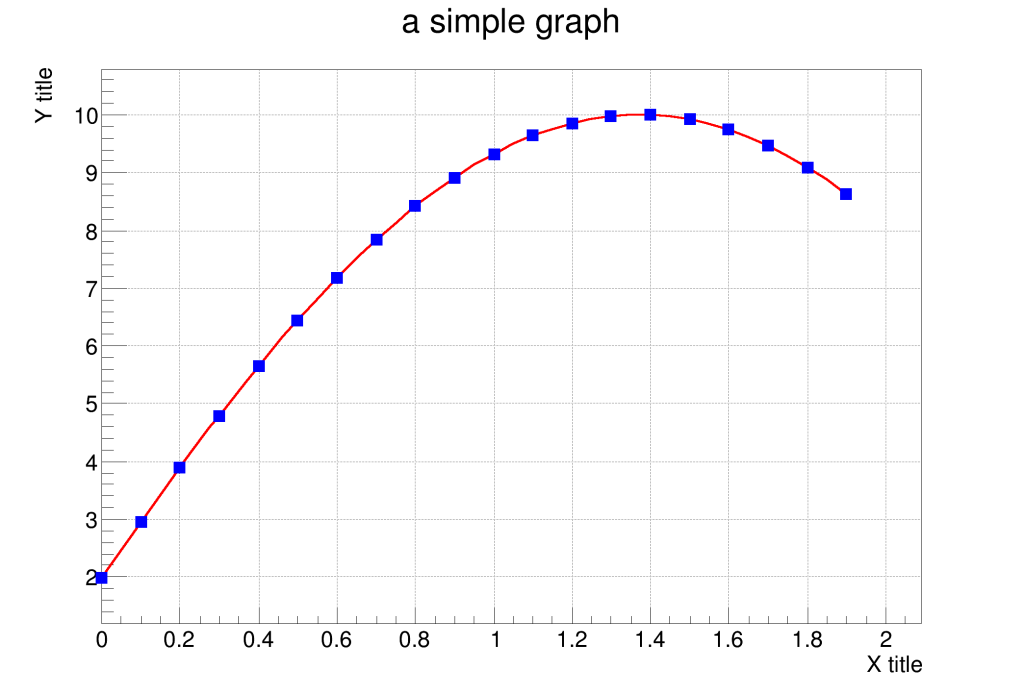
A graph is a visual representation of a set of data points or values that are connected to one another. It can be used to show relationships between different variables, patterns, and trends in the data. Graphs are often used in mathematics, statistics, economics, and other fields to represent information.
