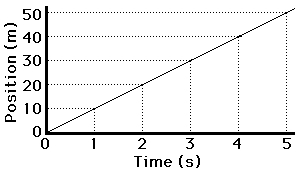
A position time graph is a graph that shows the change in position of an object over time. It is a type of line graph that plots the position of an object on the y-axis and time on the x-axis. The graph typically shows the object’s position changing from left to right as time passes. The slope of the graph is used to determine the velocity of the object.
